
Google Analytics Explained: What to Actually Look At (And What to Ignore)

This is a guide to Google Analytics for beginners — specifically for small business owners who want to understand their website data without needing a data science degree.
You set up Google Analytics because someone told you to. Maybe it was a blog post, maybe it was a developer, maybe it was that one marketing video you watched at midnight.
So you installed it. You logged in once or twice. You saw a dashboard full of numbers, graphs, and terms you didn’t recognise. And you closed the tab.
That’s where most small business owners stop. And honestly? That’s not their fault.
Google Analytics — specifically GA4, the current version — is built for data analysts, not business owners. It collects an enormous amount of information and then presents all of it to you at once, as if every number is equally important. It isn’t.
Why Analytics Actually Matters for Your Business
Before we get into the tool, let’s be clear about why this is worth your time.
Every time someone visits your website, they leave behind a trail of information. Where did they come from? What page did they land on? How long did they stay? Did they click anything? Did they leave immediately?
Without analytics, you’re running your marketing blind. You might be spending money on Instagram ads that aren’t bringing anyone to your site. You might have a page that’s getting great traffic but driving everyone away in ten seconds. You’d have no idea.
Analytics doesn’t give you all the answers. But it gives you the right questions. And for a small business, that’s enough to start making smarter decisions — without guessing. It works the same way as good market research — both are about understanding your audience before you spend a single dirham on marketing.
The GA4 Reality Check: What Changed and Why It Matters
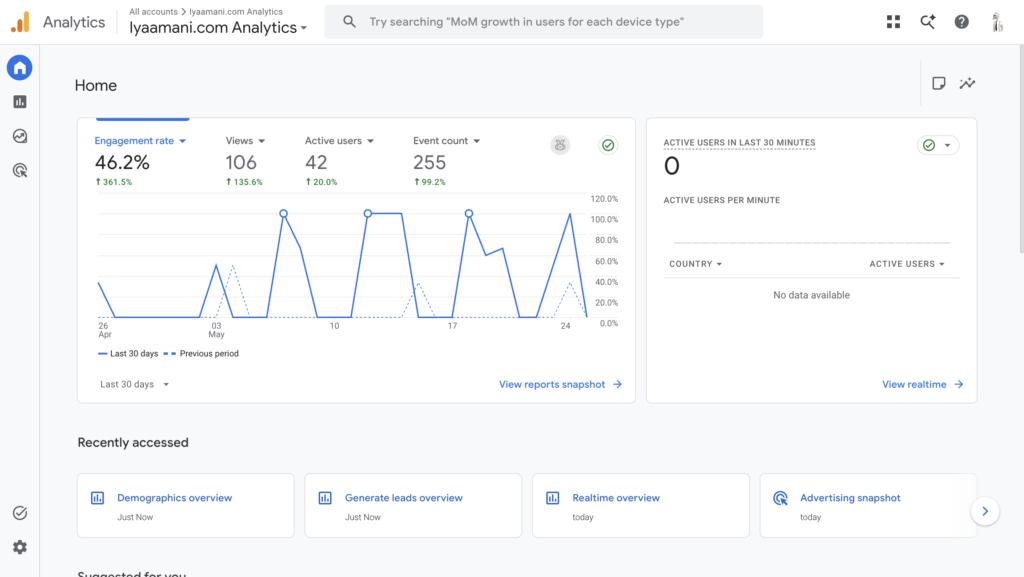
If you’ve tried to follow a Google Analytics tutorial online and it looked nothing like your actual dashboard, this is why.
In July 2023, Google shut down Universal Analytics — the old version — and replaced it with GA4 (Google Analytics 4), which is now the only version available. The interface is different. The way data is collected is different. The reports are in different places. Everything that a tutorial written before 2023 shows you is now outdated.
GA4 tracks behaviour differently too. Instead of tracking sessions the way the old version did, it tracks individual events — every click, scroll, video play, and page view is recorded as a separate action. That’s actually more powerful for businesses once you understand it. But it’s also why opening GA4 for the first time feels like landing in a foreign country.
The good news: google analytics for beginners doesn’t require you to understand all of it — just the parts that actually affect your business.
The Only Metrics a Small Business Needs to Start With
GA4 has dozens of reports — which is exactly why google analytics for beginners feels so overwhelming at first. Most of them you can completely ignore.
Users. This is how many individual people visited your site in a given period. Not page views — actual people. If this number is growing over time, your visibility is improving. If it’s flat or falling, something needs attention.
Sessions. A session is one visit. One person can have multiple sessions if they come back on different days. If your users count is high but sessions are much higher, people are returning — which is a positive signal. If sessions are very low, people aren’t coming back, which is worth paying attention to.
Engagement rate. This replaced the old “bounce rate” in GA4. It measures the percentage of visits where someone actually interacted with your site — scrolled, clicked, stayed longer than ten seconds. A healthy engagement rate for most small business sites sits somewhere between 50–70%. If yours is below 40%, your page is either loading slowly, confusing visitors, or not matching what they expected to find.
Conversions. A conversion is whatever action matters most to your business — a contact form submission, a phone call click, a sign-up. GA4 can track these, but you need to set them up manually. If you haven’t done this yet, it’s the single most valuable thing you can configure. Without it, you’re tracking traffic but not outcomes.
That’s it for starters. Four numbers. Once these feel familiar, everything else starts to make sense naturally. When you’re ready to go deeper, Google’s free GA4 certification walks you through the full platform at your own pace — and it’s completely free.
Traffic Sources: Where Your Visitors Are Actually Coming From
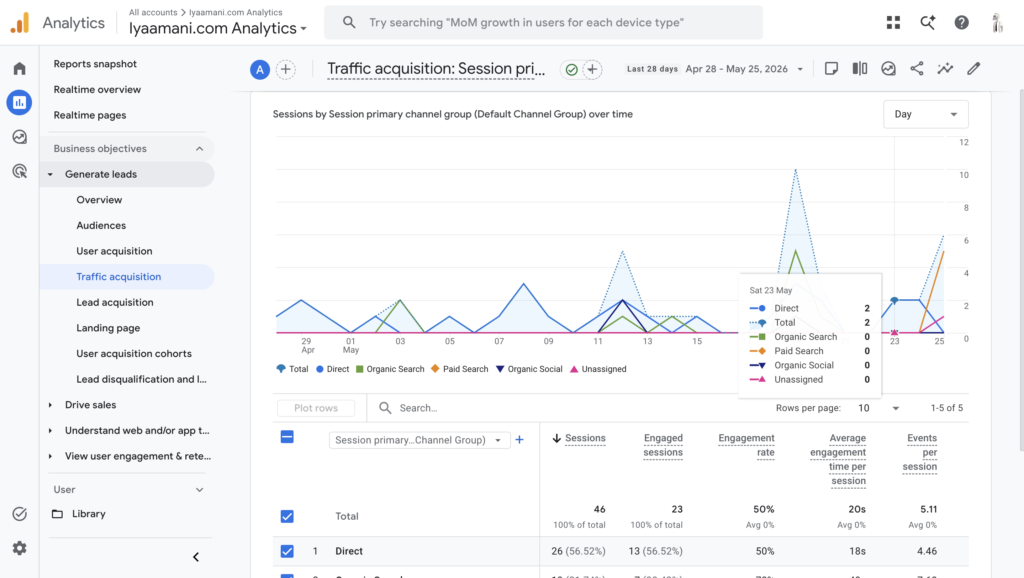
One of the most useful things GA4 shows you is where your visitors came from before they landed on your site. In GA4, this is found under Reports → Acquisition → Traffic Acquisition.
You’ll see several channels listed. Here’s what they actually mean.
What Each Traffic Source Means
Organic search means someone found you through Google without clicking an ad. They typed something in, you showed up in the results, they clicked. This is the traffic your SEO efforts are building — slow to grow, but highly valuable because these visitors were actively looking for what you offer. You can see exactly which search terms are bringing people to your site for free using Google Search Console — it works alongside GA4 and gives you keyword-level detail that GA4 alone won’t show you.
Direct means someone typed your URL directly into their browser, or clicked a link in an app where the source couldn’t be tracked (like some email clients). Often this means people who already know you exist. If this number is growing, your brand awareness is improving.
Referral means another website linked to yours and someone clicked that link. This is good — it means other sites are mentioning you and sending you traffic. It’s also a signal Google uses when deciding how trustworthy your site is.
Social means someone clicked through from a social media platform — Instagram, LinkedIn, Facebook, wherever you’re active.
Paid search means someone clicked a Google ad you’re running.
The question to ask every time you look at this report is simple: which source is sending me the most useful visitors — not just the most visitors? Sometimes a small amount of organic traffic converts better than a large amount of social traffic. The source matters less than the behaviour of the people who came from it.
User Behaviour: What Happens After They Land
Traffic sources tell you where people came from. User behaviour tells you what they did once they got there.
In GA4, go to Reports → Engagement → Pages and Screens. This shows you which pages on your site people actually visited, how long they spent there, and how many sessions each page received.
Look for two things.
First, your most visited pages. Are these the pages you want people to spend time on — your services page, your contact page, your most important blog posts? Or are people landing on a random page and never going anywhere else? If visitors are consistently landing on a page that isn’t moving them toward contact or a decision, that page needs work. This might be related to website issues you haven’t spotted yet — ones that are quietly pushing people away.
Second, your drop-off points. Where do people leave? If almost everyone leaves from your homepage without visiting anything else, your homepage isn’t giving them a reason to go deeper. If people visit your services page and then leave without clicking contact, something about that page is creating hesitation.
User behaviour data is where GA4 gets genuinely useful for small businesses. It stops you from guessing why your website isn’t converting and shows you exactly where the breakdown is happening.
Turning Data Into One Decision: The Simple Weekly Routine
The reason most business owners don’t use analytics isn’t because they don’t care. It’s because every time they log in, they don’t know what to do with what they see. They look at numbers, feel vaguely informed, and change nothing.
Here’s a simpler approach. Once a week, spend five minutes answering three questions.
Is my traffic going up, down, or flat compared to last week? If it’s down significantly, something changed — a post stopped ranking, an ad paused, a traffic source dried up. Worth investigating.
Where is most of my traffic coming from? Is that source growing or shrinking? If organic search is your main channel, keep publishing content. If social is your main channel and it’s inconsistent, you’re building on unstable ground.
Which page had the most visitors this week — and did those visitors do anything useful? If your most visited page has low engagement, that’s where to focus your energy.
That’s a five-minute weekly habit. Do it consistently for three months and patterns will start to emerge that you’d never notice by looking once a quarter.
Over time, those patterns connect directly to your broader digital marketing strategy — helping you understand not just what’s happening on your website, but why your marketing is or isn’t working overall.

You Don’t Need to Understand Everything. Just Start.
Most small businesses don’t lack data — they lack clarity. GA4 is full of reports you’ll never need to look at. Advanced segments, predictive metrics, custom funnels — those exist for analysts at companies with dedicated data teams. That’s not you, and that’s fine.
What you need is a clear window into a small number of signals. Users, engagement, traffic sources, and page behaviour. And when your analytics shows you which pages people trust most, that data feeds directly into how you build and communicate your brand — because trust online is built one consistent interaction at a time. Those four things, checked weekly, will tell you more about your business than any expensive marketing report.
And if at some point the data shows you something surprising — traffic dropping from a source you didn’t expect, a page converting better than your homepage, visitors spending three times longer on one blog post than another — that’s when analytics stops being a chore and starts being genuinely useful. It shows you what’s working before you’d ever figure it out on your own.
Set it up. Check it consistently. Let the patterns teach you.
One Question Before You Go
Analytics tools can feel very different depending on where you are in your business.
Some people have never opened GA4 once. Some have it installed but have no idea if it’s actually tracking correctly. Some check it regularly but still don’t know what to do with what they see.
Where are you right now — and what’s the one number or report in GA4 that confuses you most?
Drop it in the comments. I’ll answer directly.
If you’d like help setting up GA4 properly for your business, or want someone to look at what your data is actually telling you — let’s talk. No pressure, just a straight conversation.